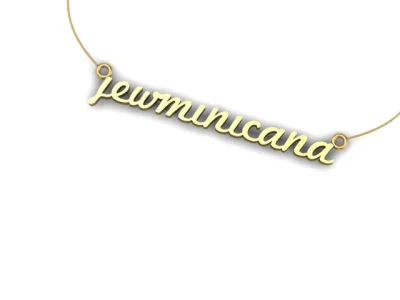
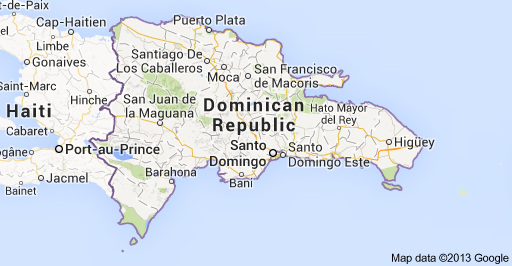
As far as I knew before any genealogical tests, I was Dominican: the product of a white Dominican father and a mixed race afro-Dominican mother. I was decidedly Spanish. I was also African. And maybe I was a bit Taino, the Native Americans who were on the island before the Spanish descended upon them.
And then my AncestrybyDNA results came in.
According to the most plain and least informative (unless you read the included manual) test which gave me a nice shiny certificate, my genetic ancestry was broken up into:
62% European
11% Indigenous American (Taíno)
24% Sub-Saharan African
3% East Asian
I was really excited that I had Taino blood. It meant that some of my ancestors had been in the Dominican Republic before 1492. I had no idea how to wrap my head around how European I was, how little African (as most people think I’m 50-50 European and African) and whoa, where did East Asia come from?!
The test also mentioned that I could be a lot more of each of these groups. My sisters and I were most curious about the East Asian. We figured the European was just Spanish. Yeah, right.
Then my 23andMe results came in. I found out helpful health information like what diseases I might be susceptible to but I already knew about all of them based on my knowledge of my mother’s family’s health history and bits and pieces about my father’s family’s health history.
These were my favorite results because they were the most comprehensive. I got an update on the haplogroup L that my most ancient ancestors belong to: from just L, I got upgraded to L2a1.
I was still Bantu and Khosian but West Africa, North Africa, Central Africa and South Africa–isn’t that all Africa?–had been thrown and more specifically, Kenya. Even maternal Ashkenazi Jewish ancestry was, well, possible.
23andMe breaks down your ancestry composition into three groups: Standard Estimate, Speculative Estimate and Conservative estimate…which told me what I was, what I might be, what I definitely was and what I definitely was not!
“Ancestry Composition tells you what percent of your DNA comes from each of 22 populations worldwide. The analysis includes DNA you received from all of your ancestors, on both sides of your family. The results reflect where your ancestors lived 500 years ago, before ocean-crossing ships and airplanes came on the scene.”
Standard Estimate:
54.4% European:
31.1% Southern European:
9.8% Iberian, 1.9% Italian, 0.1 Sardinian and the rest 19.3% Nonspecific.
1.2% Northern European
22.2% Nonspecific European
0% Ashkenazi
Yes, the word non-specific was starting to annoy me but I was too busy looking up Sardinia, overwhelmed by how often I had been mistaken for Italian (they were right!) and wondering how my ancestors ever got up north enough to mix it up with the British and Irish or the Scandanivians, much less ANY Nonspecific North Europeans at all.
30.4% Sub-Saharan African
6% East Asian & Native American
4.7% Native American, 1.4%…NONSPECIFIC (UG!)
0.5% North African
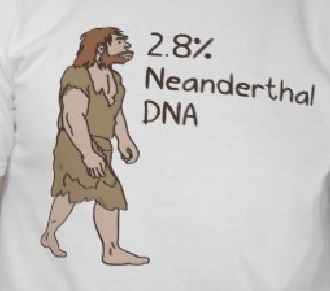
And apparently, my ancestors never saw South Asian or Australia and there was still 8.6% of me unassigned. Plus I was 2.3% Neanderthal and had to stop making jokes about them. Bummer. At least, they make shirts. (See below.)